
CTiS 2026: Accessible Computational Thinking Showcased by Vision Empower Teachers
What begins as classroom practice can grow into knowledge worth sharing. It was a proud moment to see our community of practice take its learning from classrooms to a national platform.
A 12-member team from Vision Empower, comprising teachers from special schools for children with visual impairments and Vision Empower coordinators, was selected as finalists to present at the Computational Thinking in Schools Conference (CTiS 2026) at IISER Pune. Chosen after multiple rounds of selection, the team’s participation reflects the quality and relevance of their classroom innovations in accessible computational thinking and inclusive STEM education.
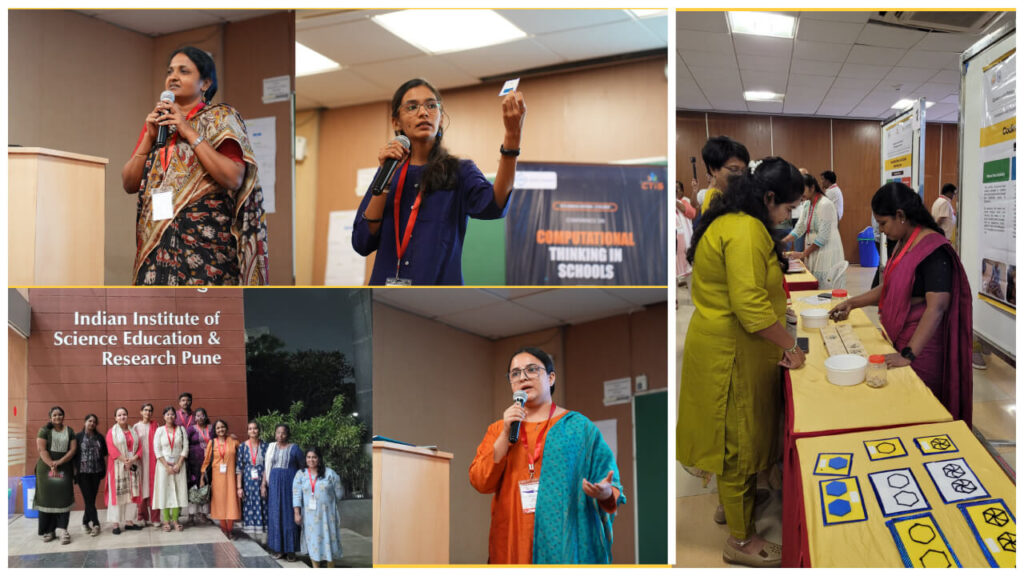
CTiS is one of the few national forums where educators from special and mainstream schools come together to exchange ideas and share innovations in computational thinking. It provided our teachers with an opportunity to showcase inclusive classroom practices for learners with visual impairments while engaging with the wider education community.
At Vision Empower, we work closely with teachers to make STEM learning more accessible by integrating computational thinking into everyday teaching. Through adapted games, hands-on activities, and accessible teaching strategies, learners with visual impairments develop logical reasoning, decomposition, pattern recognition, problem-solving, and algorithmic thinking, while strengthening their understanding of mathematics and science.
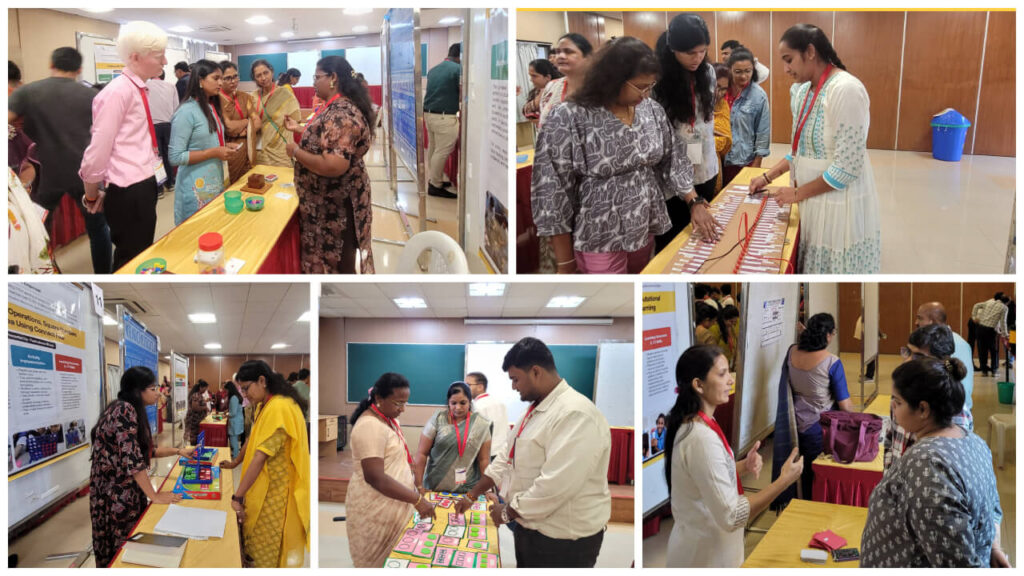
At the conference, our team presented papers and posters demonstrating how computational thinking activities can be adapted for learners with visual impairments, making STEM learning more accessible, engaging, and meaningful. These classroom practices show how accessible computational thinking can make STEM learning more accessible, engaging, and meaningful for students with visual impairments.
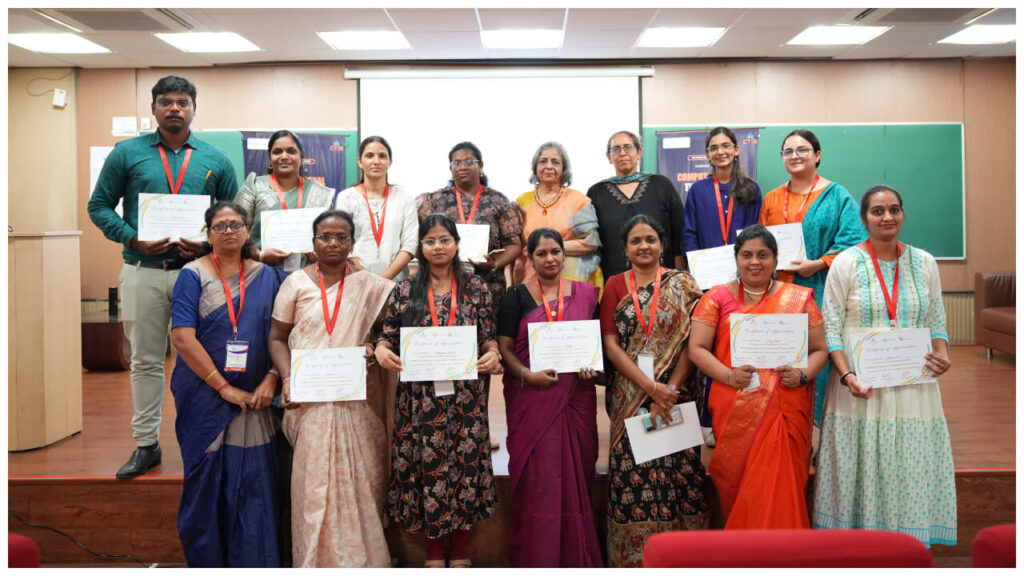
We congratulate our teachers and coordinators for sharing their classroom experiences on a national platform and thank ACM India for creating this valuable space for educators to learn from one another and advance inclusive teaching practices.
Do-it-yourself (DIY) instructions for TD
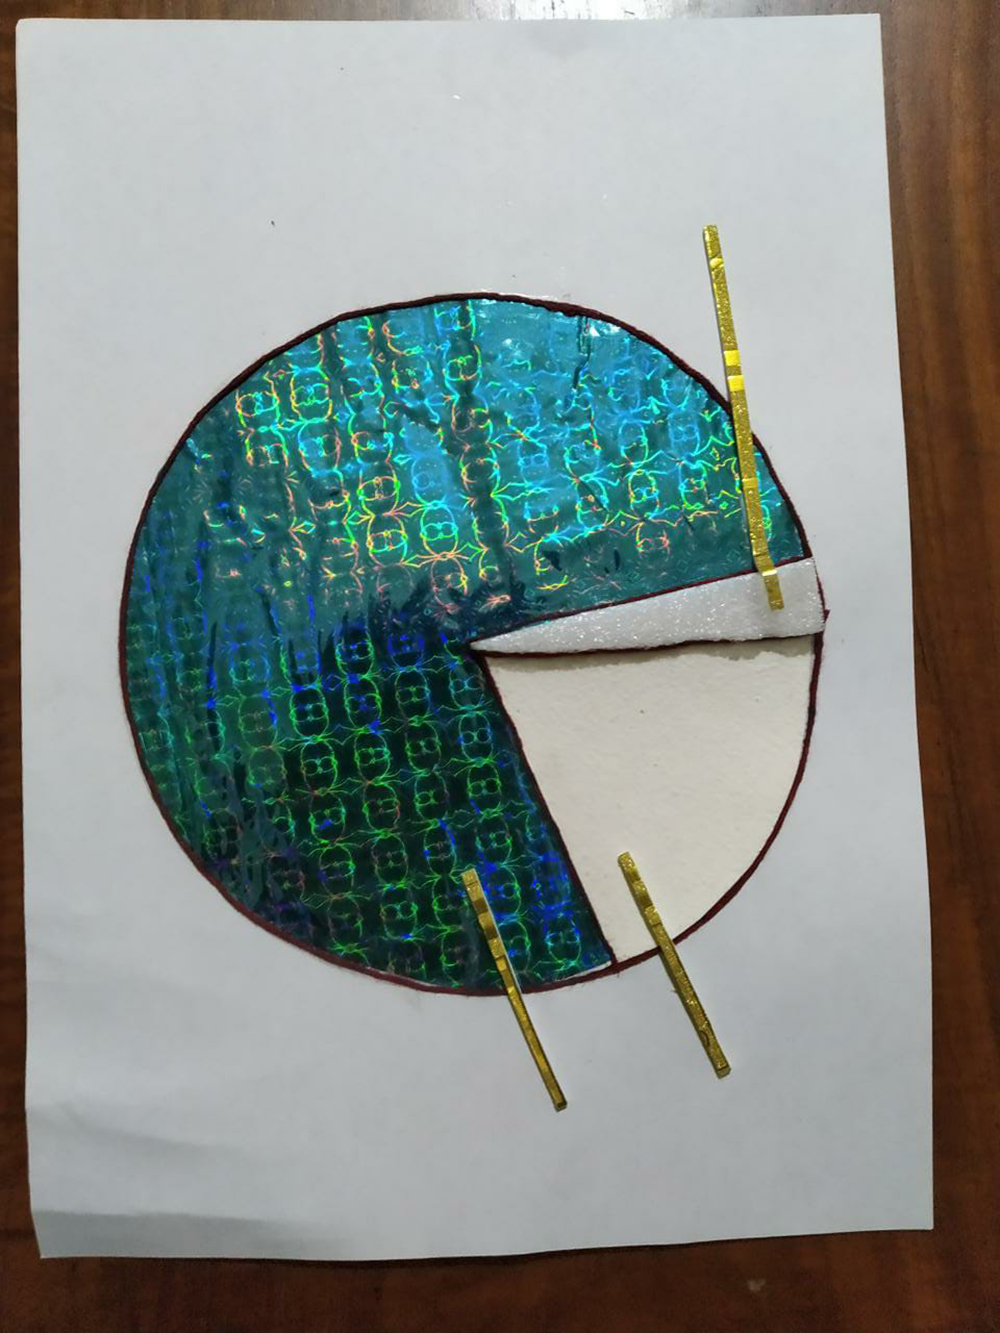
Tactile graphics are non-textual information to people who are blind or visually impaired and include tactile representations of pictures, maps, graphs, diagrams, and other images.
Given below are some links which will help caregivers or instructors make Science and Math related diagrams at home by following the steps.
Click on the video button to view.
Spatial Understanding
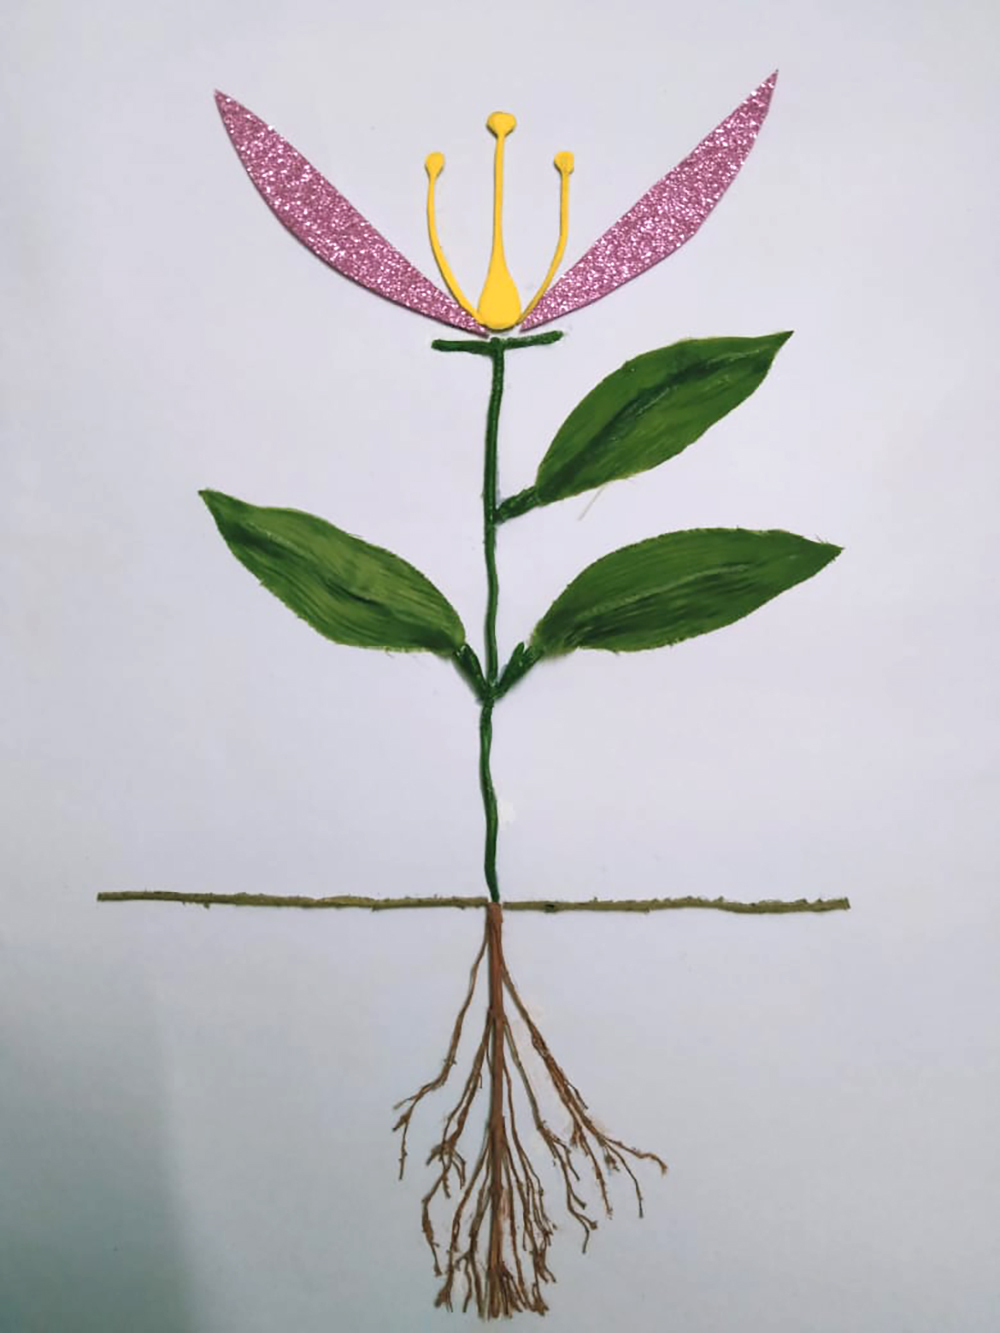
Parts of a Plant
Water Cycle
Different types of Beaks of Birds
Below are DIY instructions for Science diagrams.. These are done by a group of volunteers from Christ college.
Index of Content
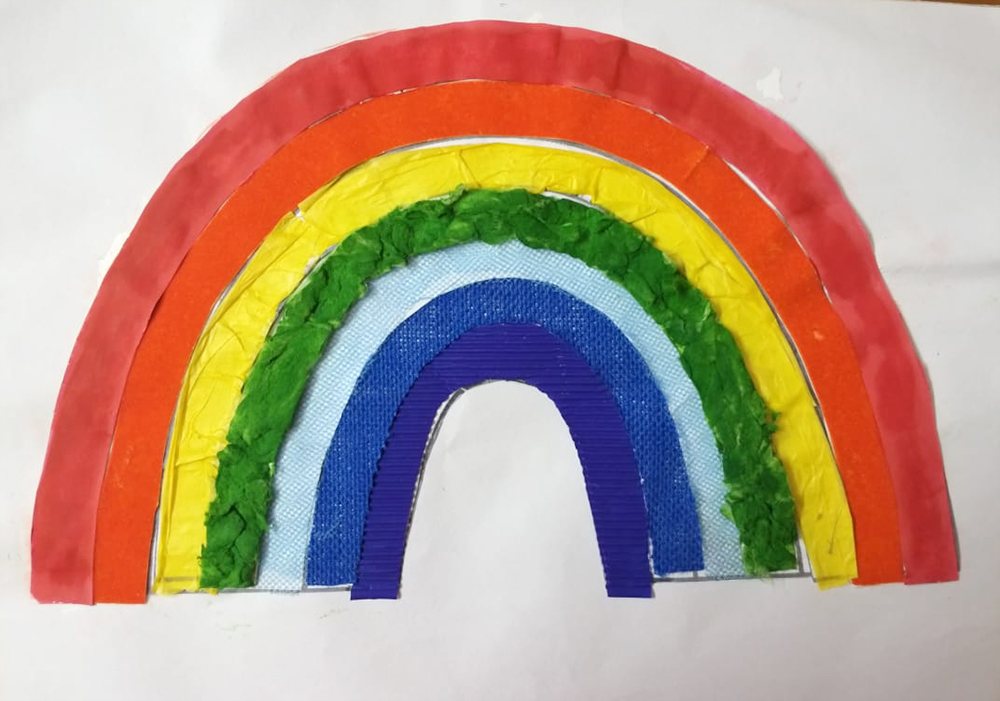
- Rainbow
- Water Cycle
- Respiratory
- Human Heart
- Digestive System
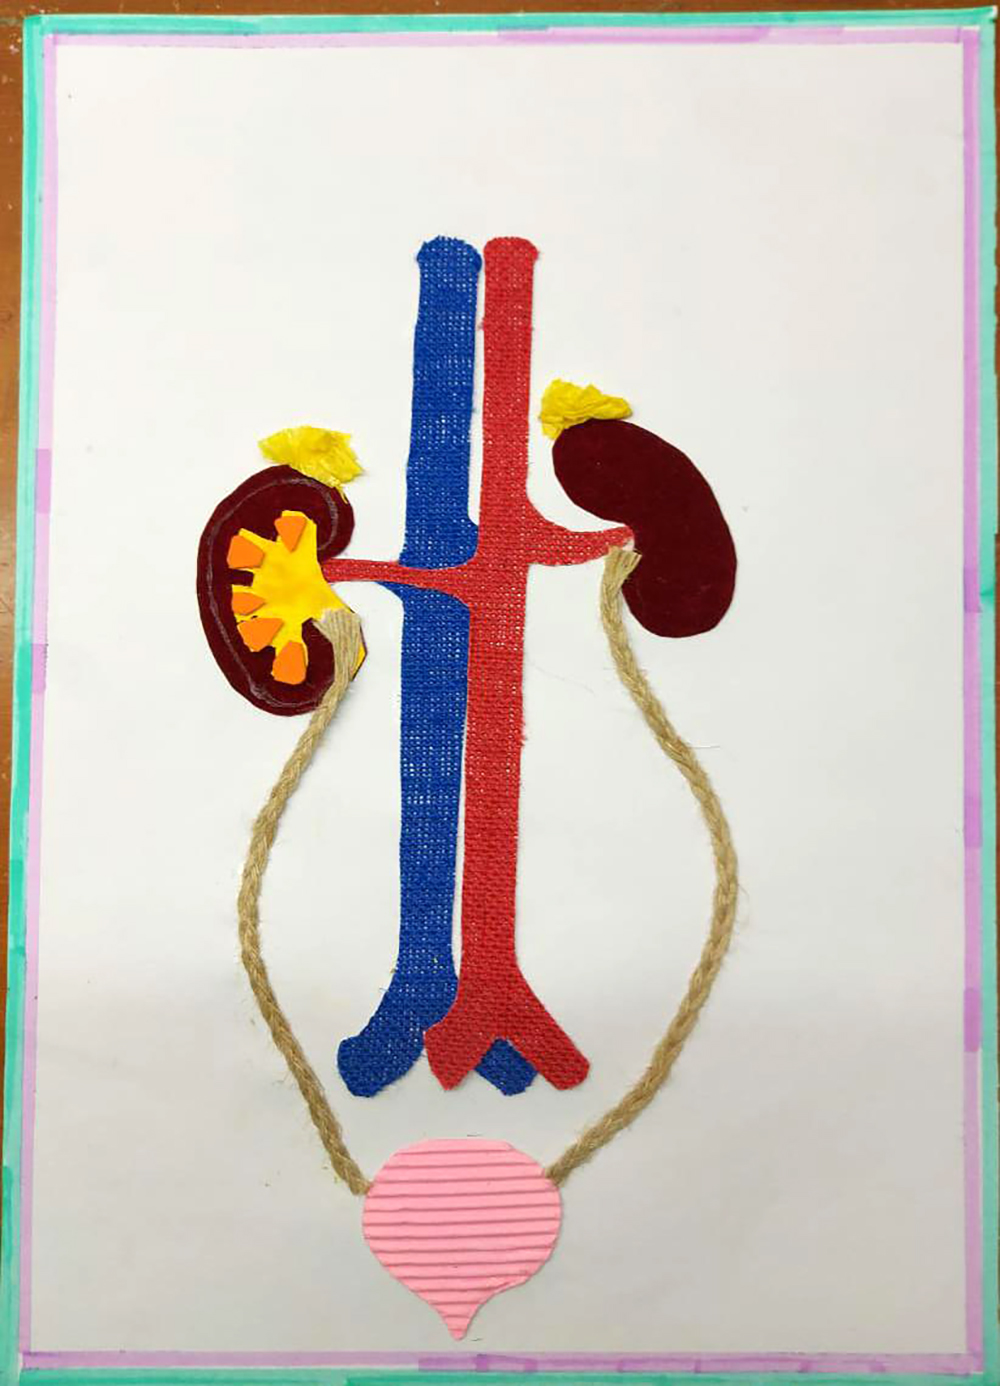
- Excretory System
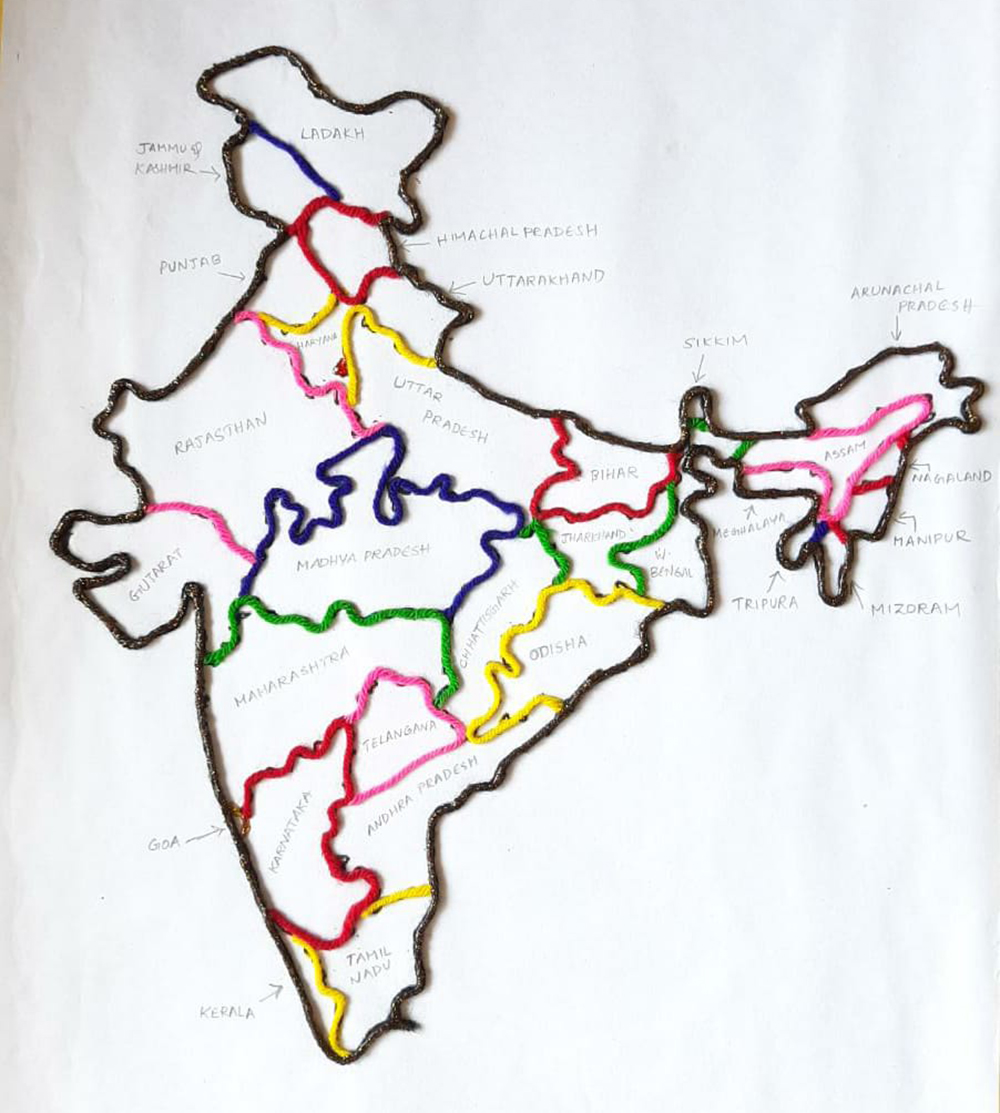
- India Map
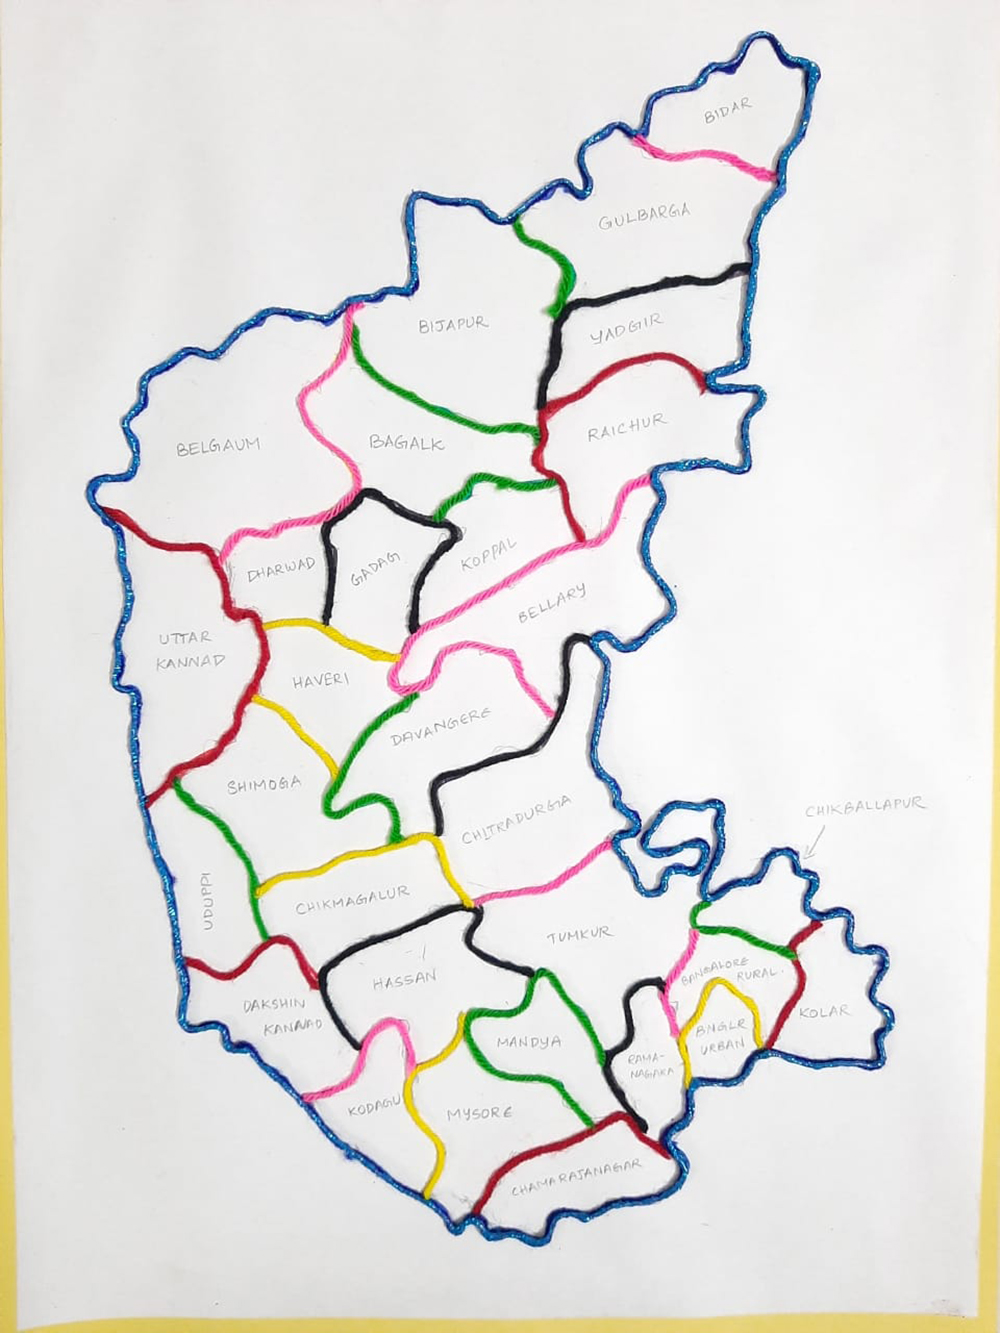
- Karnataka Map
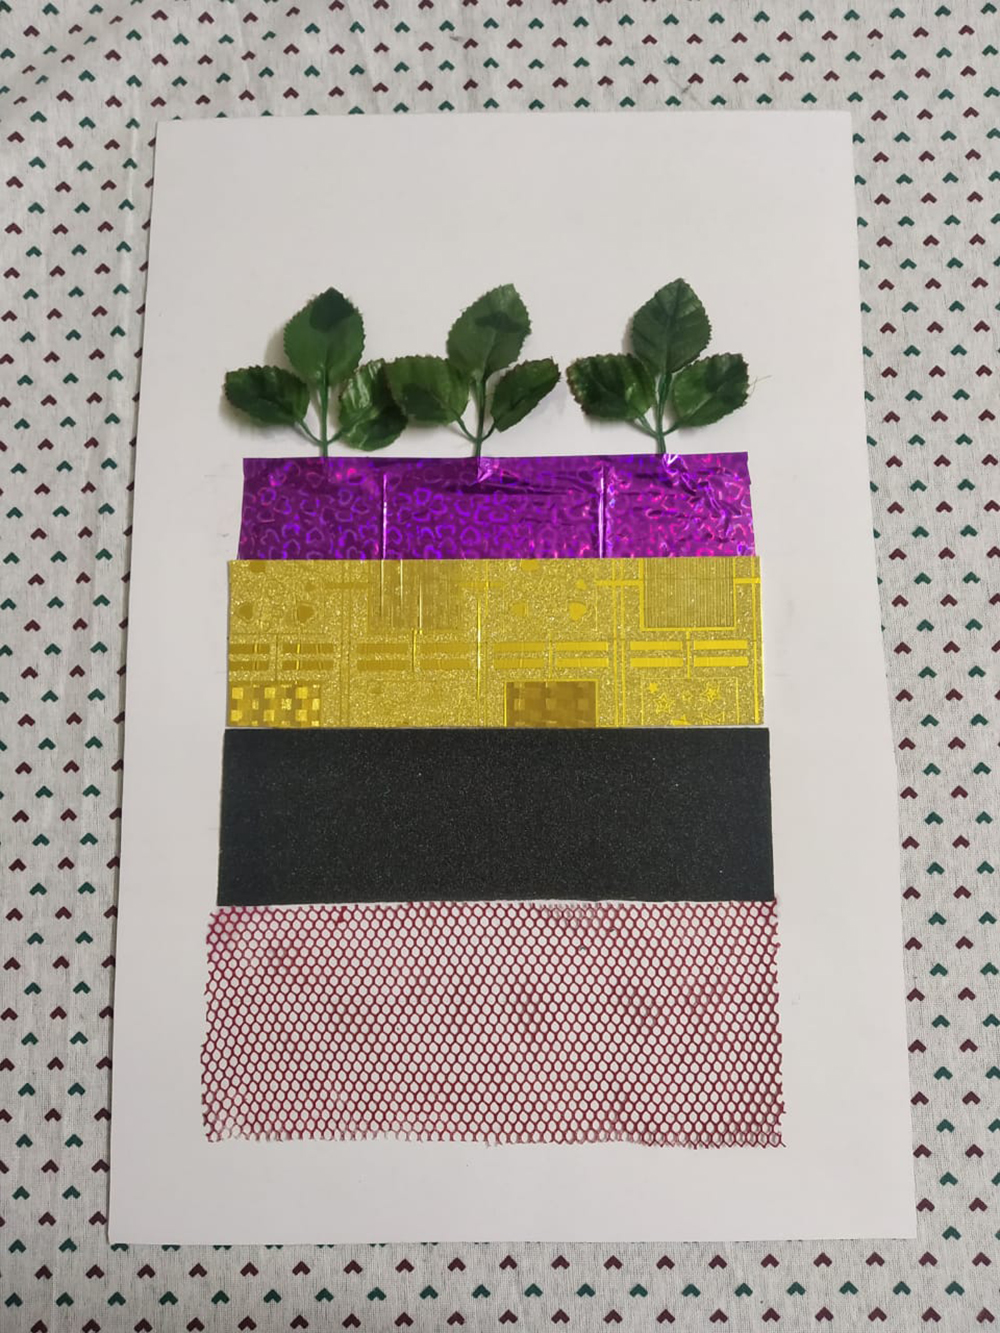
- Soil Profile
- Parts of a Plant
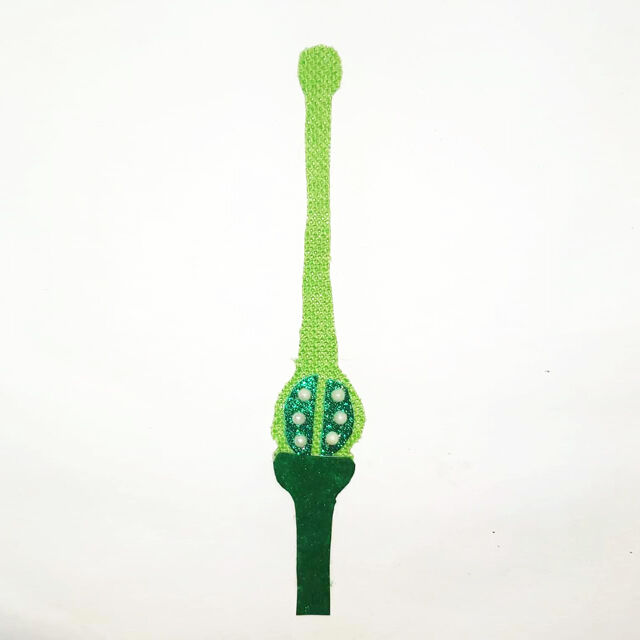
- Reproductive part of a plant – Pistil
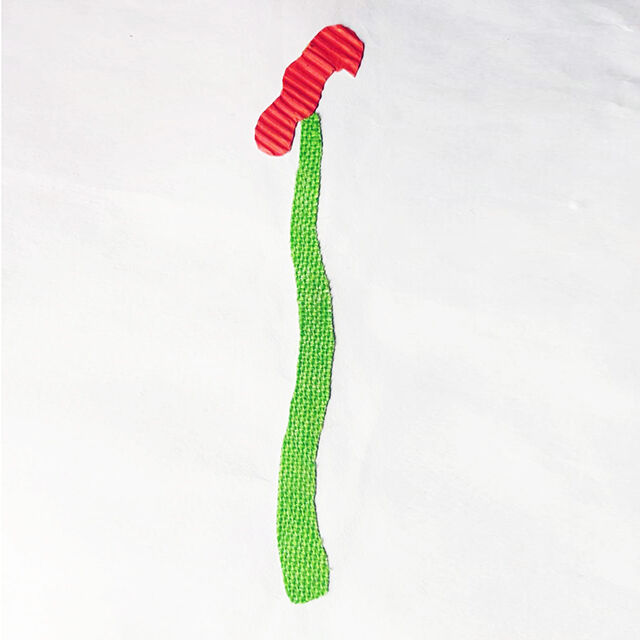
- Reproductive part of a plant – Stamen
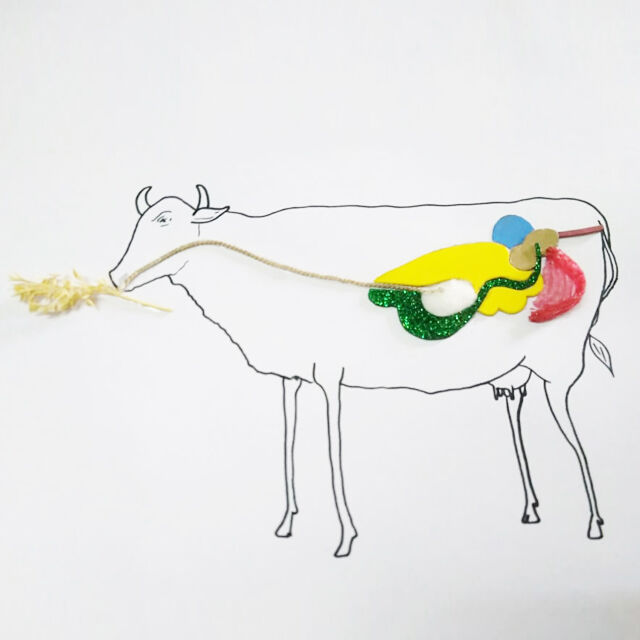
- Digestive system of a ruminant
- Fertilization in plants
- Life cycle of a silk moth
- Pitcher plant
- Reproduction in yeast
- Phases of the Moon
- Composition of Air
Click on the thumbnail to view the instructions.
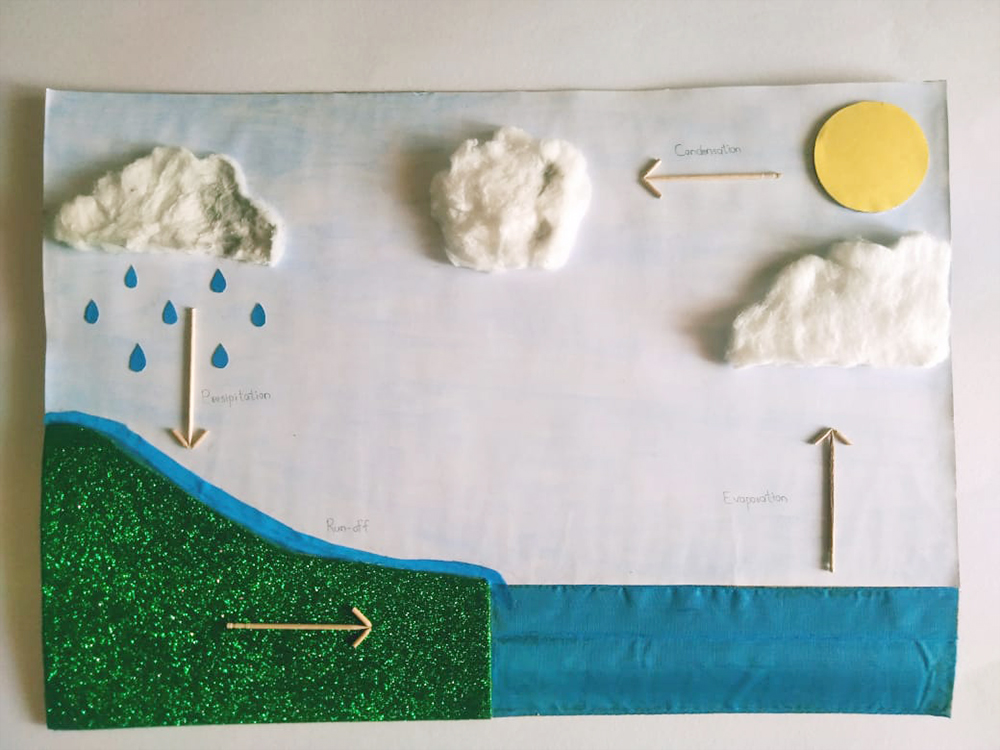
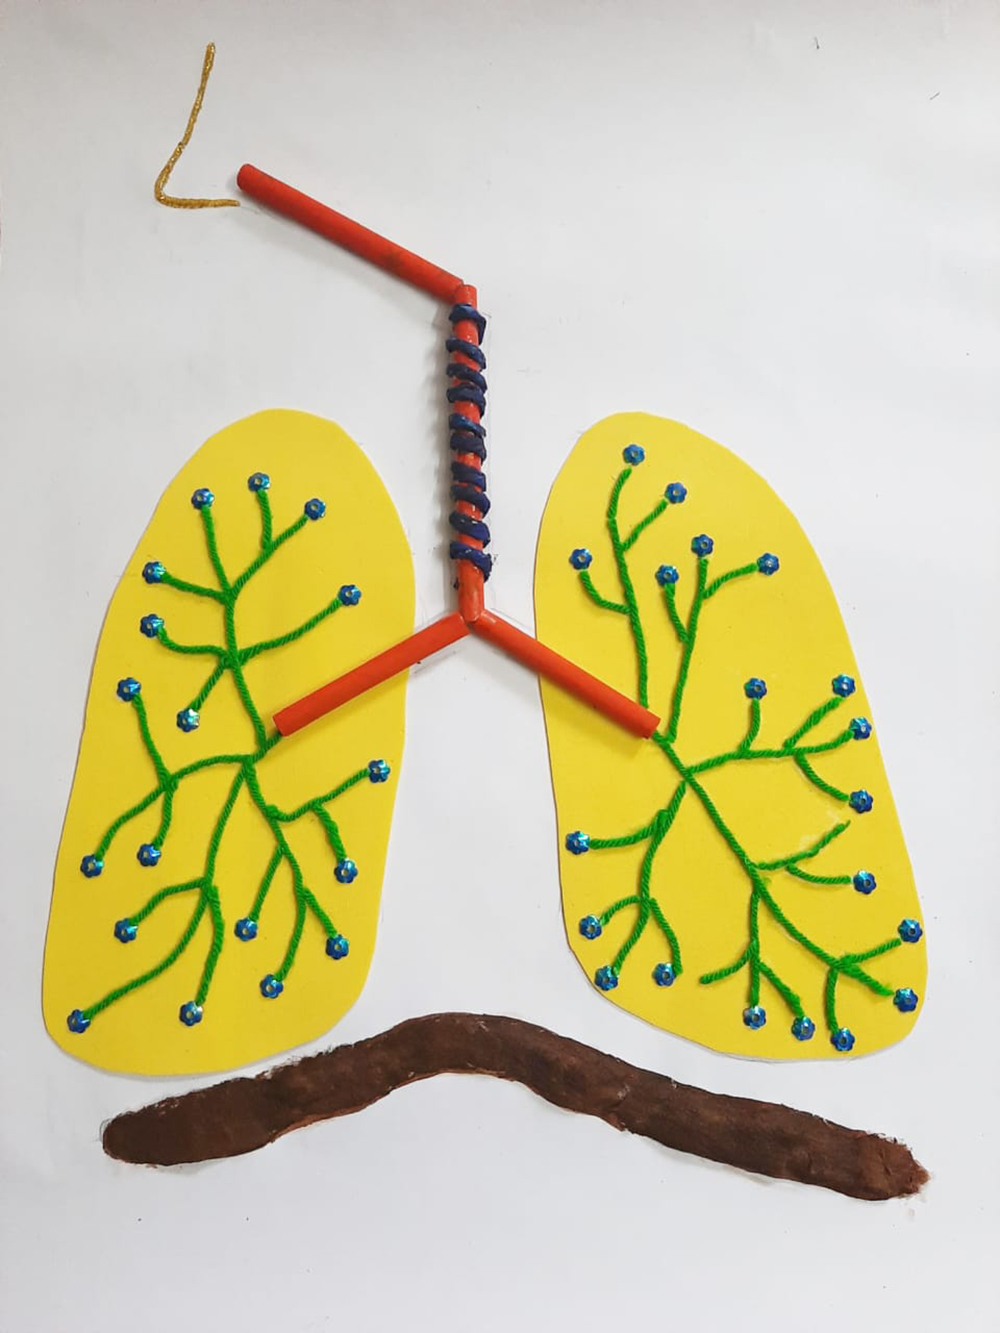
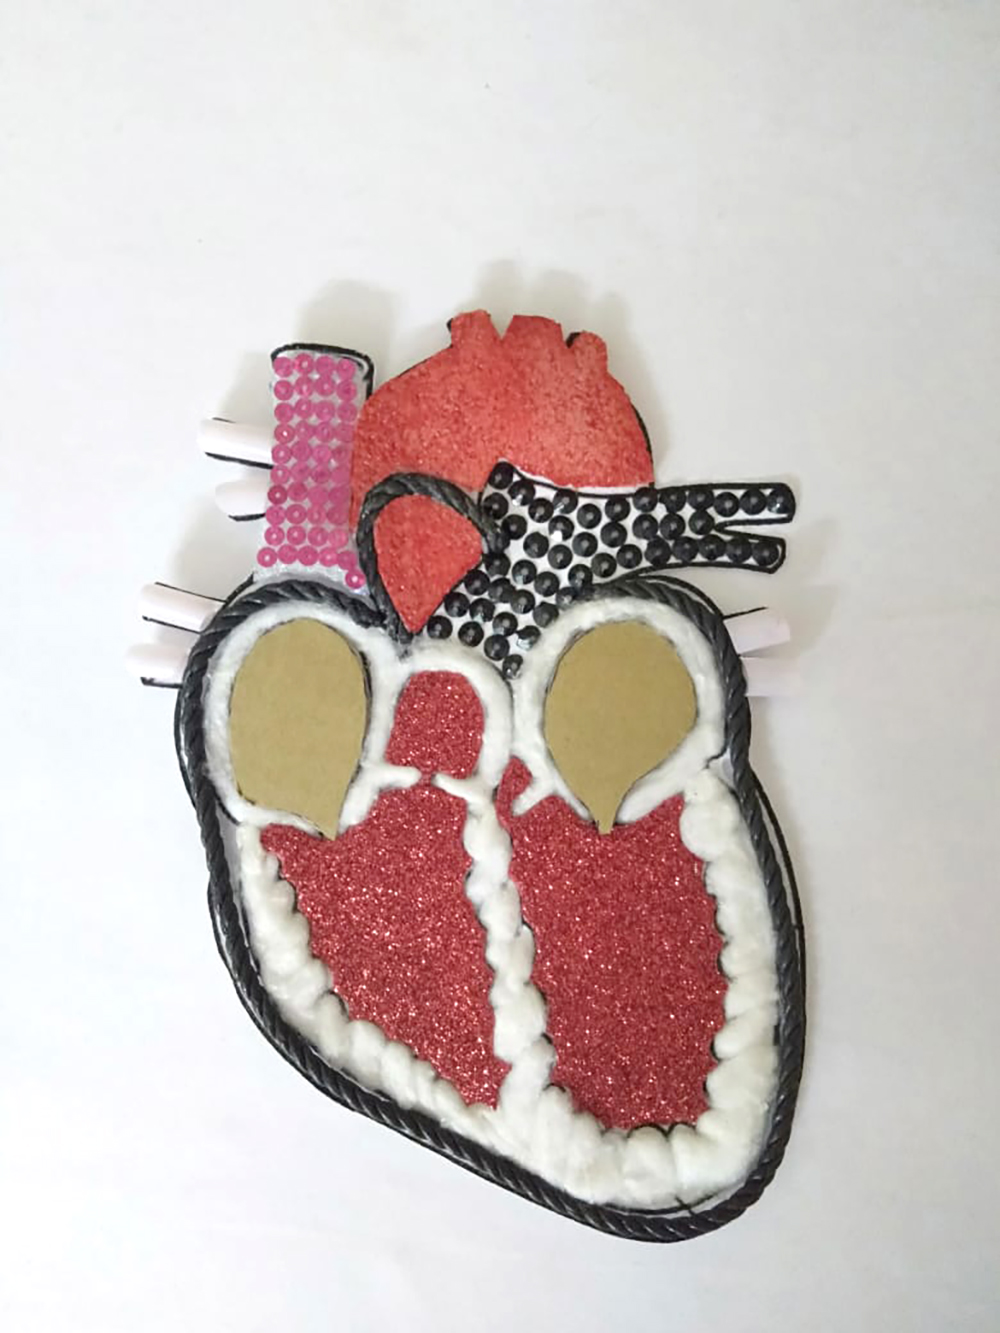
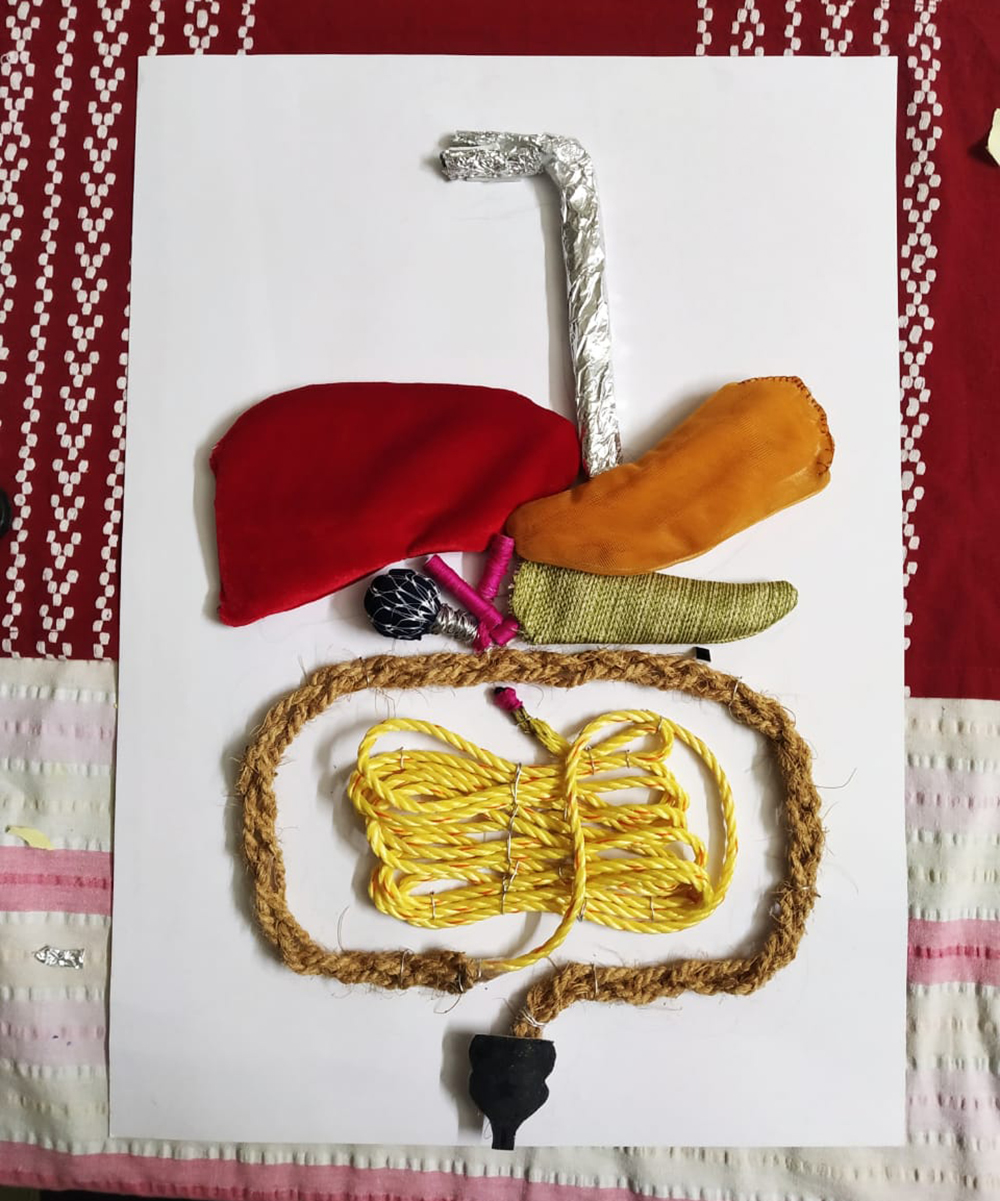

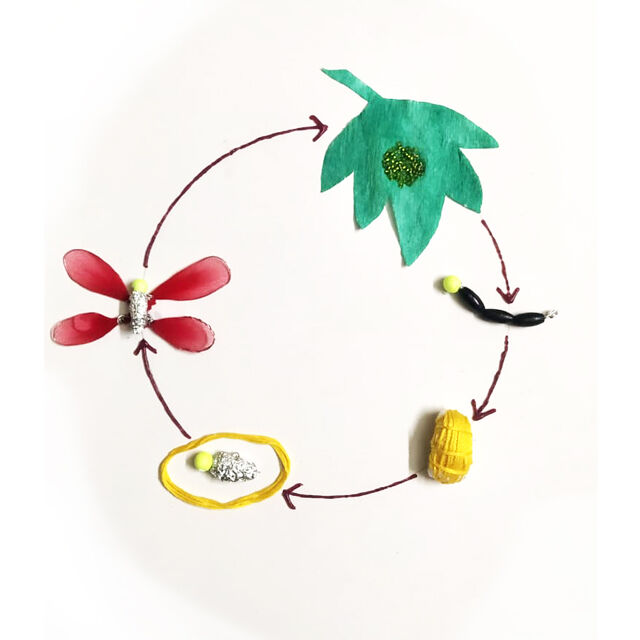
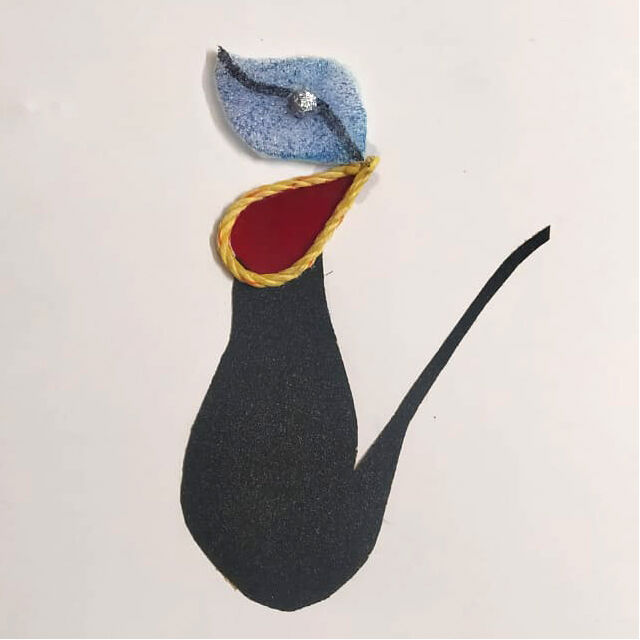
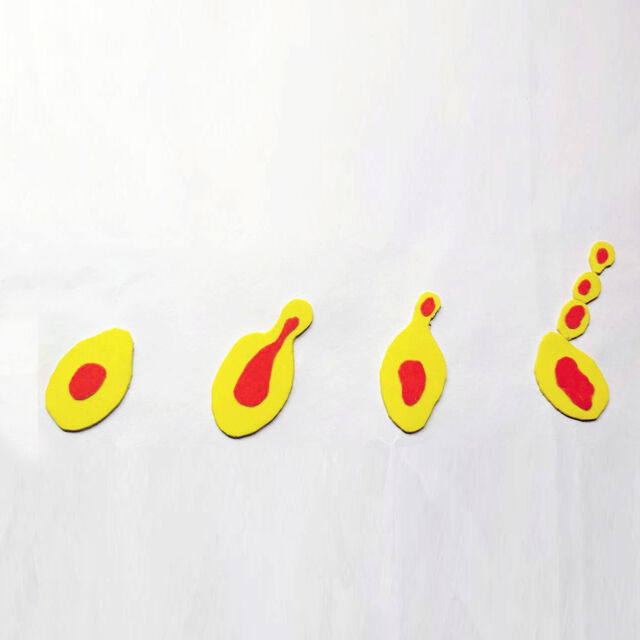
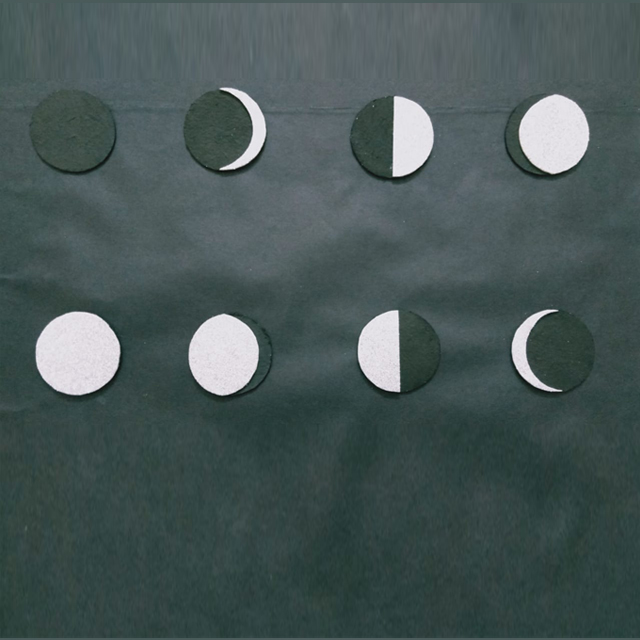
Tactile Diagram procured from Raised Line Foundation (RLF)
RLF provides tactile design and production services and is closely working with NCERT, Sarv Shiksha Abhiyaan (Govt. of India), WSSCC (UN organization) and other organization working in the field of blindness to convert textbooks, resource books, manual etc. in accessible formats along with the tactile diagrams.
Vision Empower procures high quality tactile diagrams from RLF for school students and teachers based on their specific requirements. In 2018-19, VE placed orders for specific diagrams to be designed for the EVS book for Class 5 prescribed by the Karnataka State Board. These diagrams were very useful during the pilot phase to evaluate the process of diagram comprehension by children with blindness. In 2019-20, VE evaluated the use of RLF diagrams to be used for TAG (Tactile Audio Gallery) to help children with blindness to self-learn. In 2020-21, VE has procured Science tactile diagrams for students in Grade 10.
Pictures of materials we received from RLF
Tactile Diagrams created by Tactograph
Tactograph, a product from Enability Foundation enables the printing of tactile books and worksheets at an affordable price. It is a motorized x-y stage that traces a predefined picture using an adhesive fluid, creating a tactile image on a normal A4 sized paper.
To make this printing process user friendly a Graphical User Interface (GUI) is developed with image recognition algorithm. This algorithm helps the teacher to print the tactile image in just four mouse clicks. VE and Enability collaborate to create tactile diagrams for Science and Math, to meet the needs of teachers and children in schools for the blind in Karnataka.
Few pictures of TDs created using Tactograph